An architectural game-changer for spreadsheet-driven solutions
![]() ClearFactr offers seamless support for driving your models with limitless amounts of data stored in Databricks.
ClearFactr offers seamless support for driving your models with limitless amounts of data stored in Databricks.
And while we know you can do this completely on your own, we'd welcome the chance to bring our decades of application and solution building experiences surrounding data modeling and design into a discussion, all to help assure your maximum success. Driving arbitrarily-complex spreadsheet compute models with external data might be new to your enterprise. But once you get started, you'll wonder how you did it any other way.
In fact, we're so convinced this can be such a revolutionary approach for solution building, empowering teams across the enterprise to collaborate like never before, we wrote a short white paper about it.
You'll want to check out this page, too, for more information about this important aspect of ClearFactr and how it can transform your data and compute solutions.
Click Here to See It In Action
It's important to note that unlike BI tools that are designed to scroll through tons of data, ClearFactr is a spreadsheet in the traditional compute-model sense, one with arbitrary complexity and flexibility designed entirely by you and your team.
For example, here's a model that contains 4 queries (denoted by the purple cells, automatically highlighted by the External Cell Type button in the toolbar):
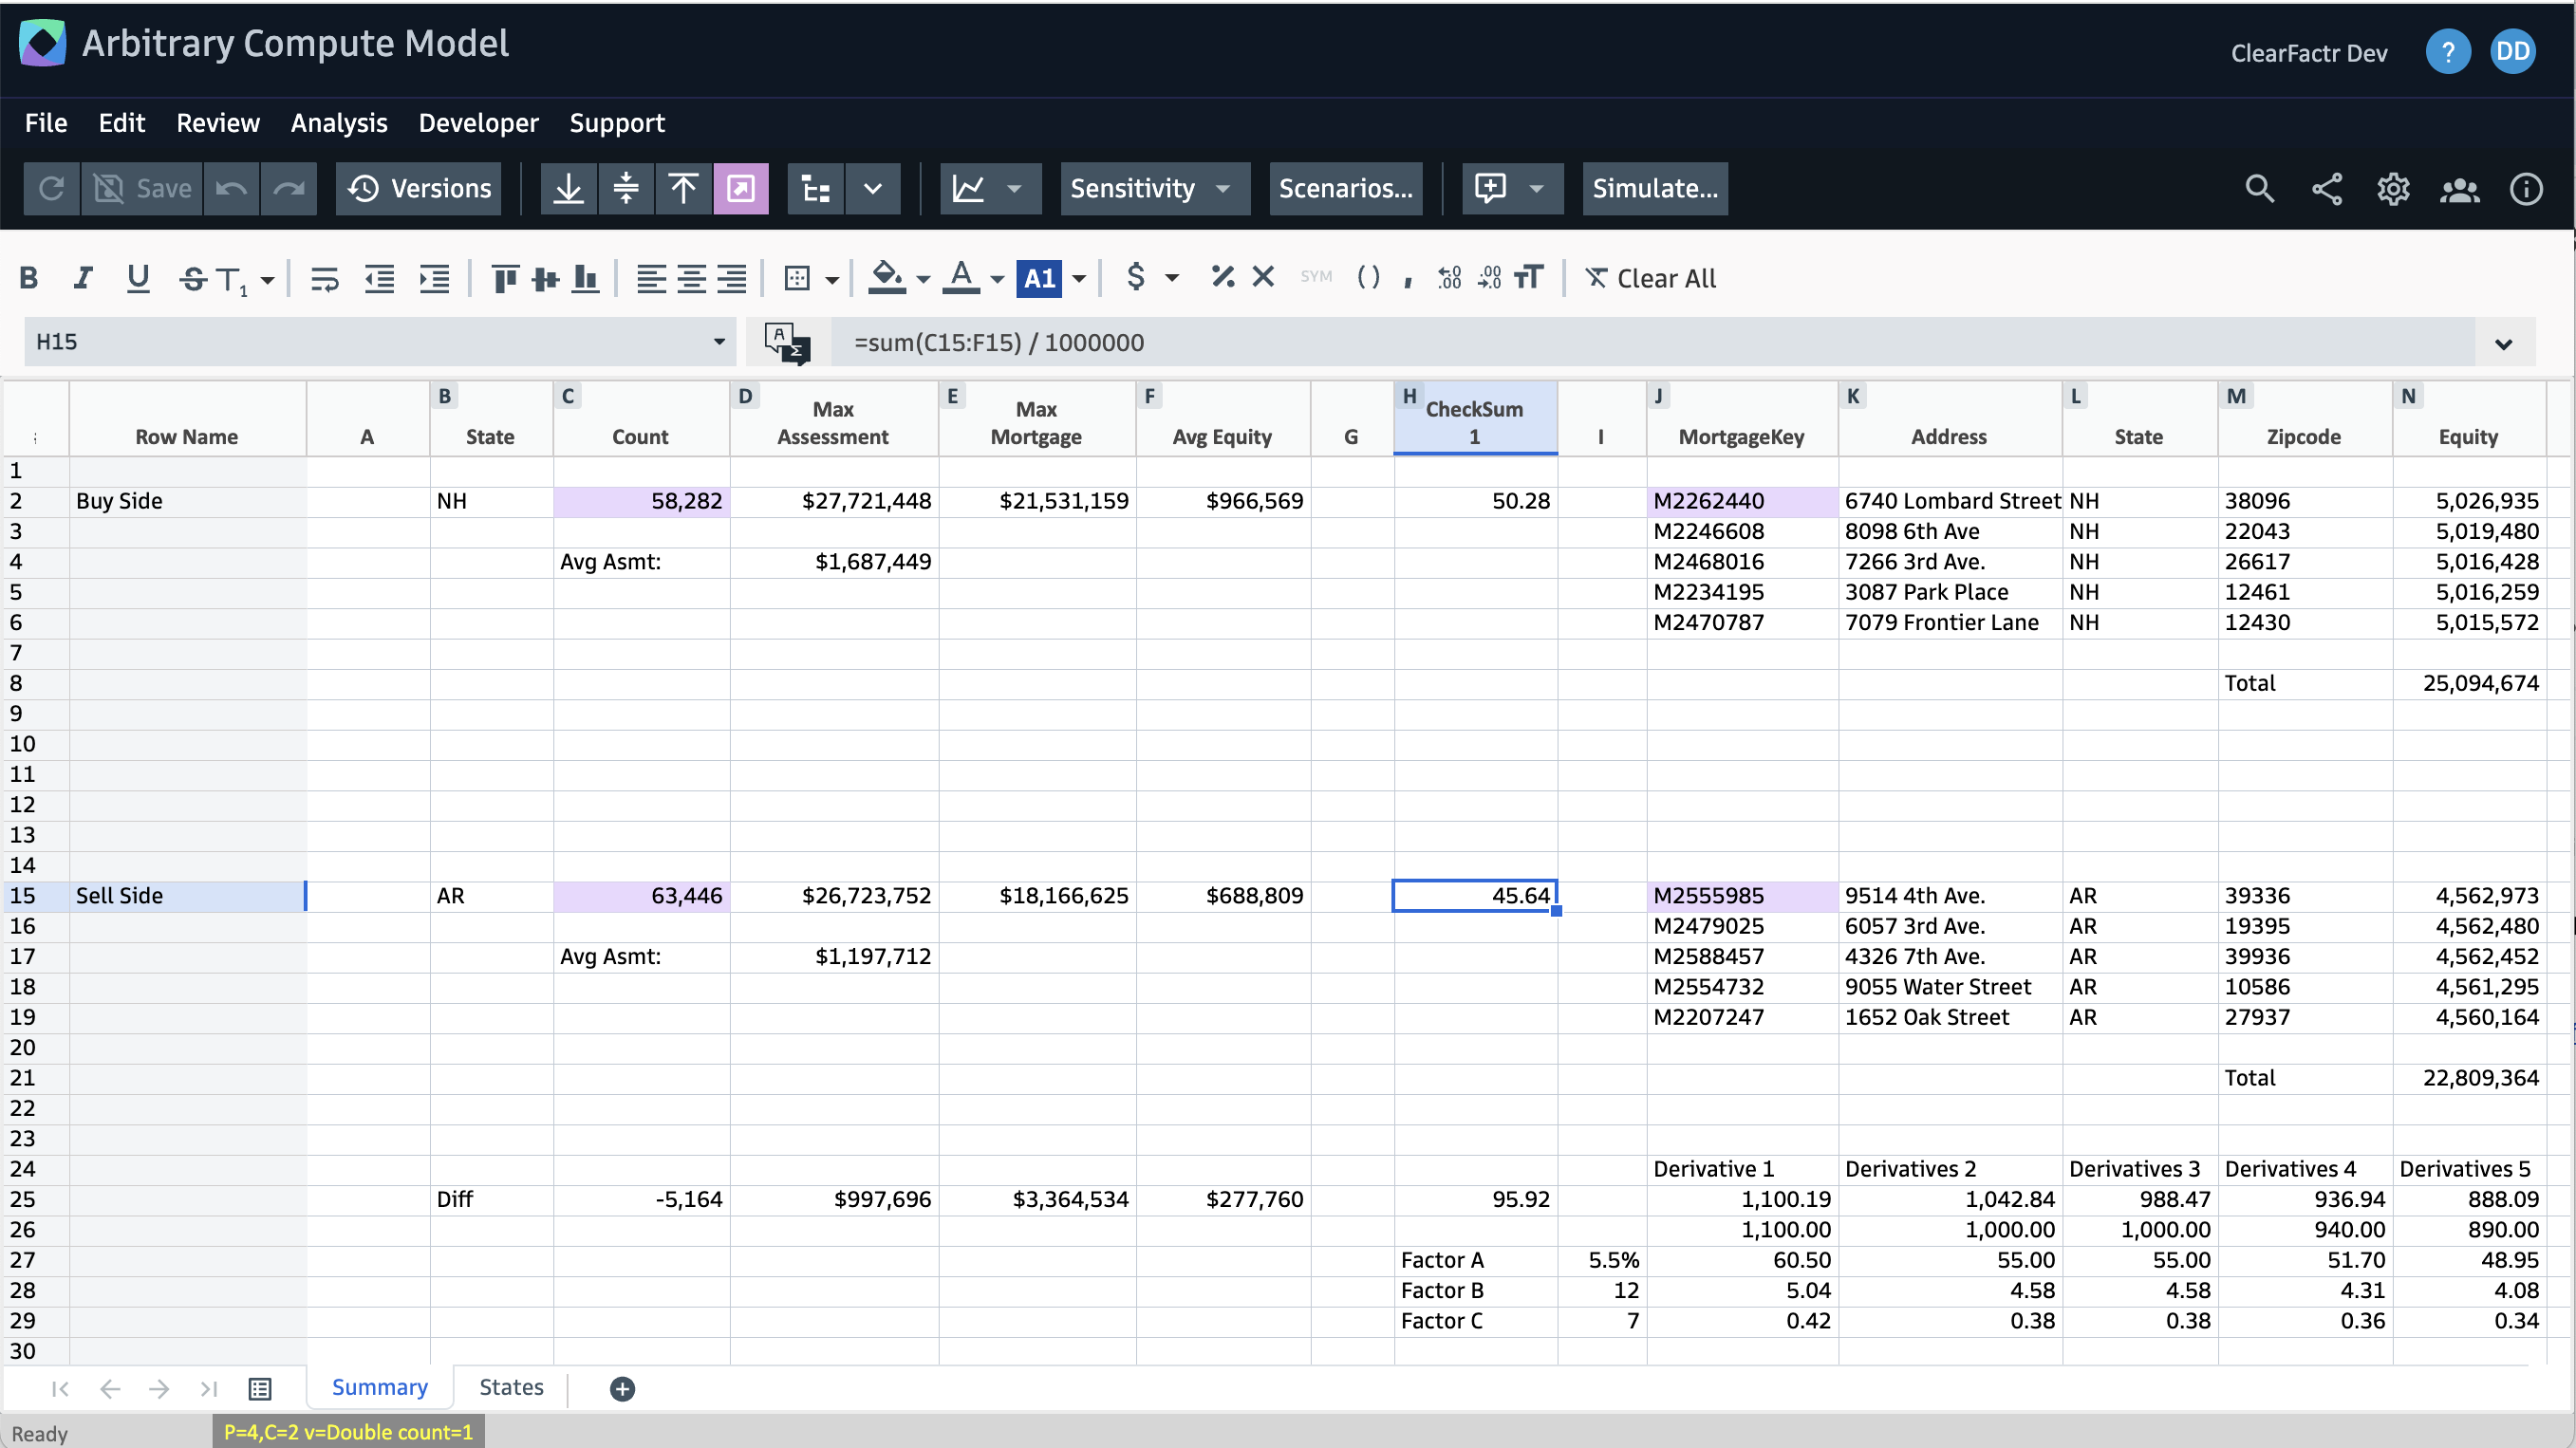
The two query cells on the left are driven by a Buy Side and Sell Side State, "NH" and "AR" in this case. When the summary data for those states is retrieved, a checksum value is computed by the model in the middle of the screen. The Cell Ancestry tool shows the downstream effects of one of those: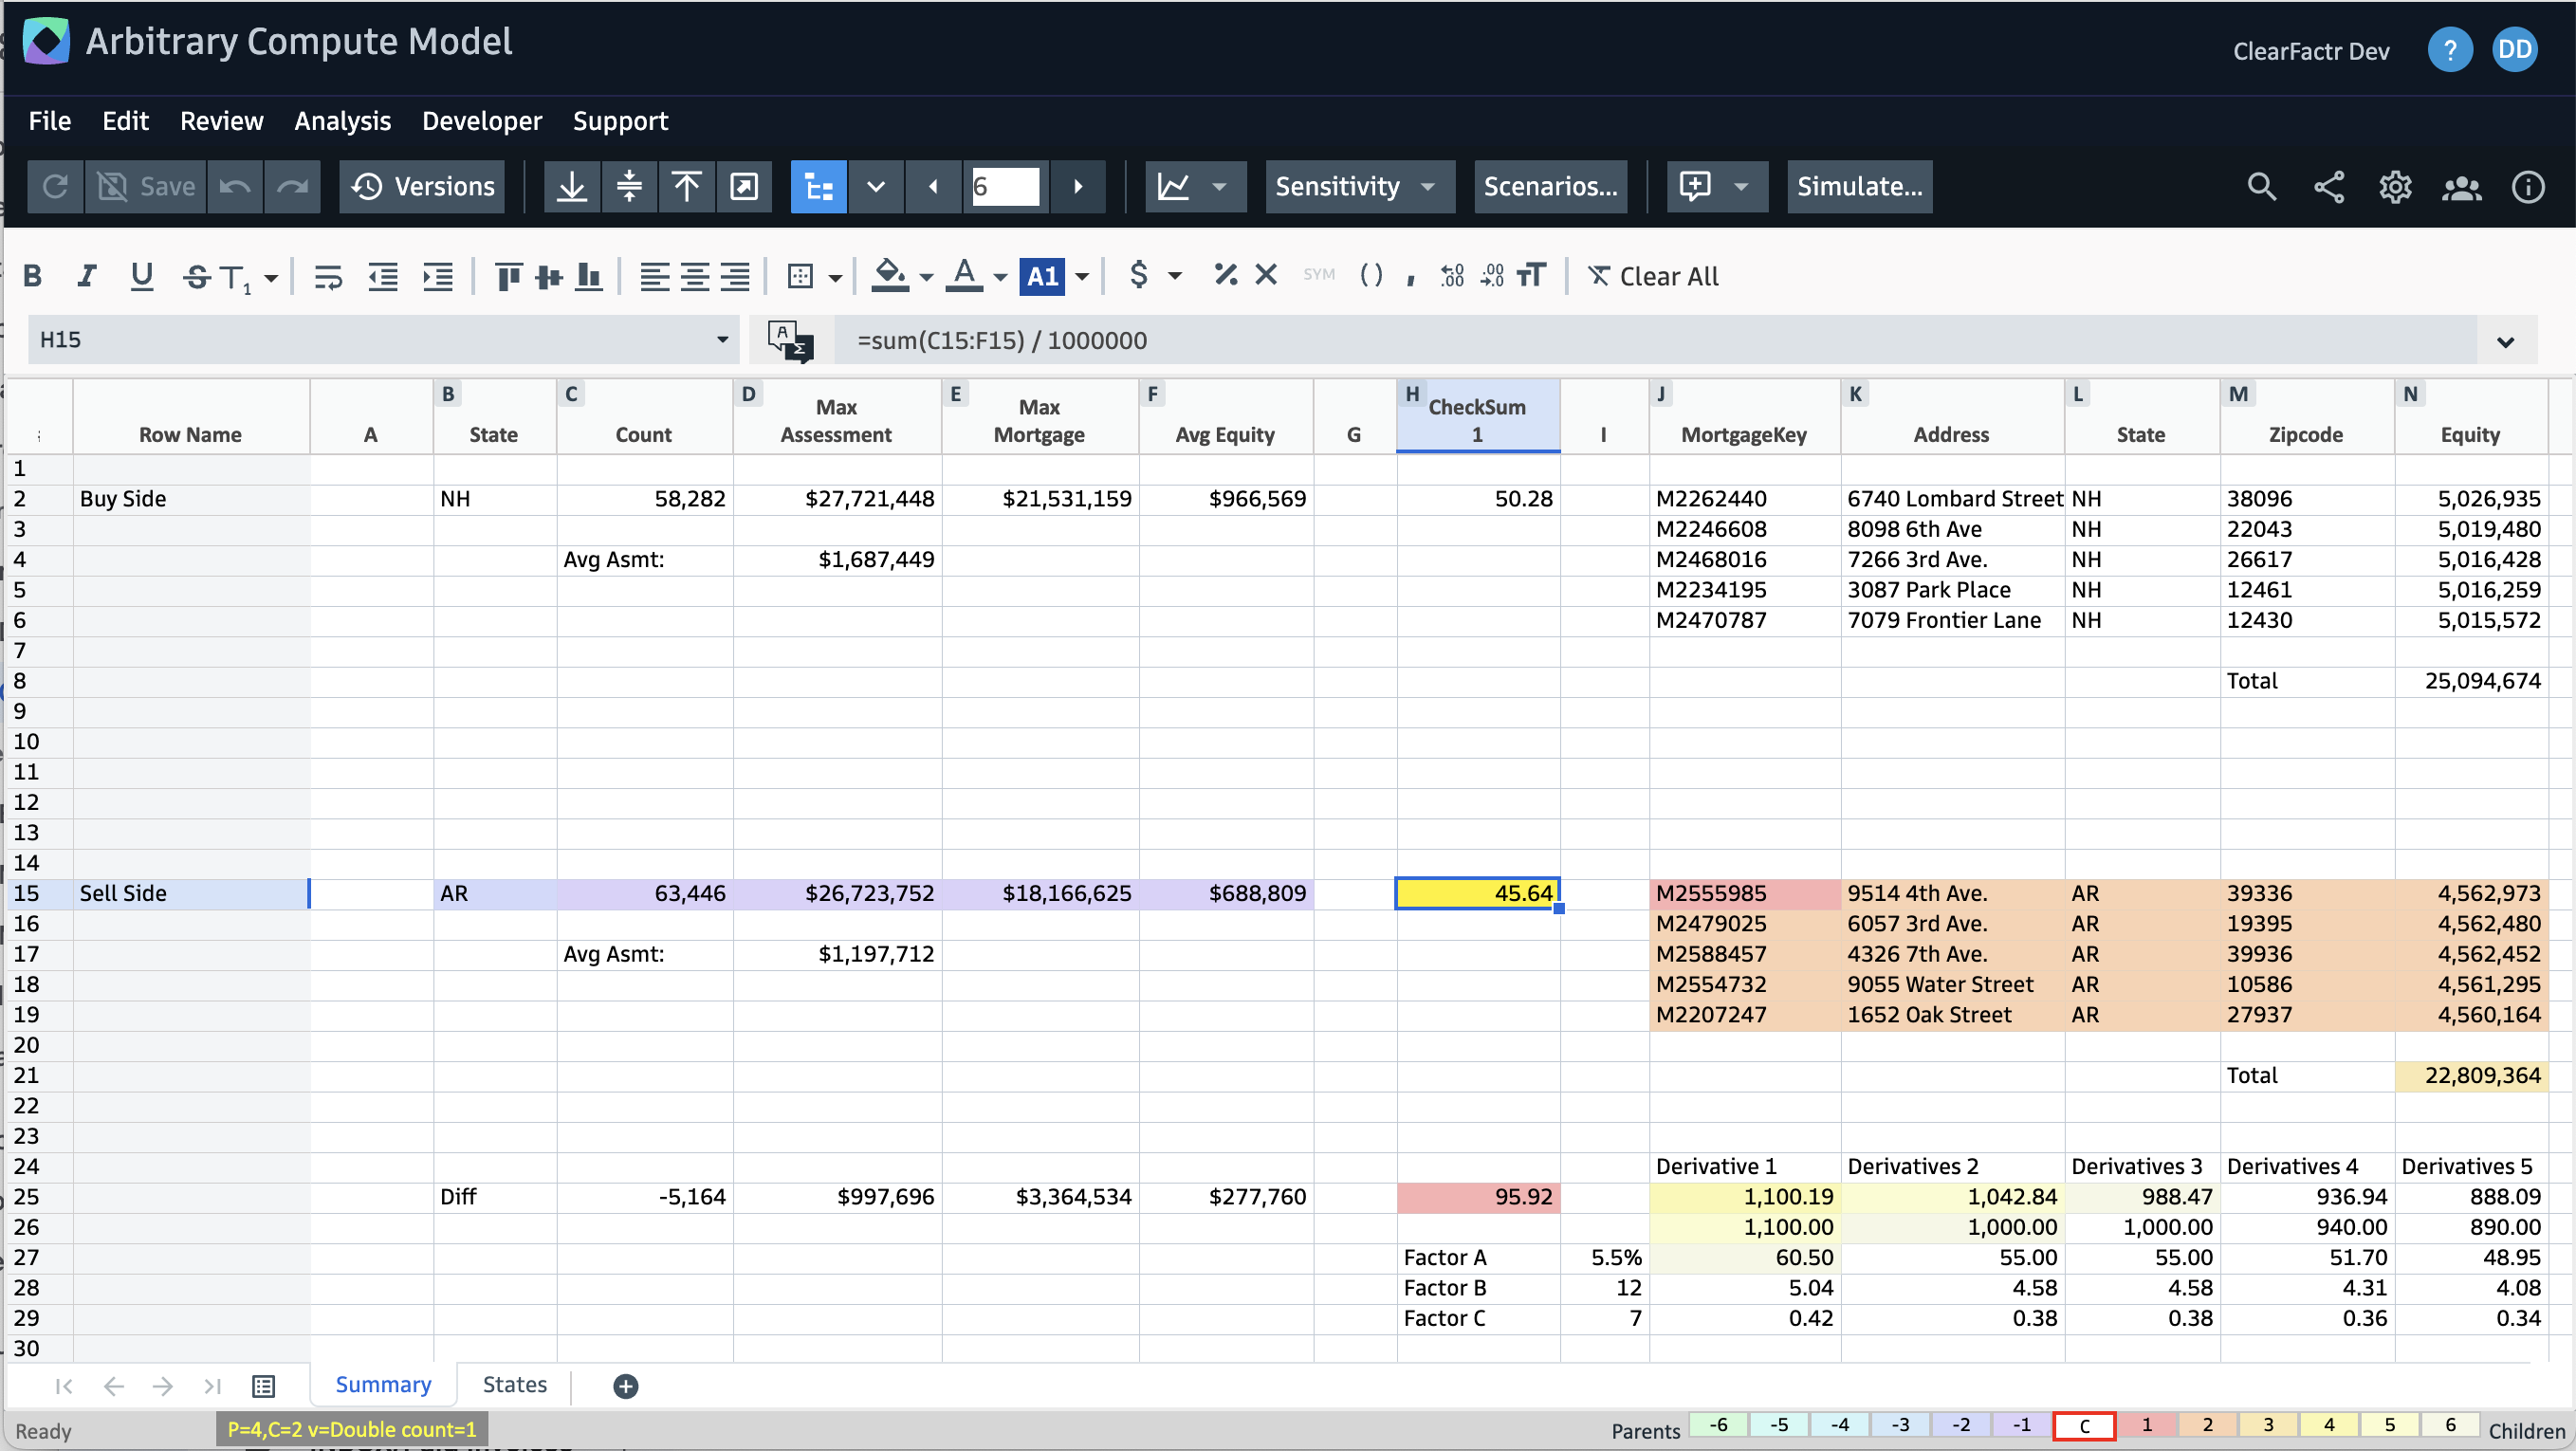
For both the Buy Side and Sell Side states, some mortgage detail data is brought in on the right side of the screen, qualified by the checksum values. Some differences between the Buy and Sell sides are shown in row 25.
When we select a different Sell Side state, that data changes as well as everything downstream: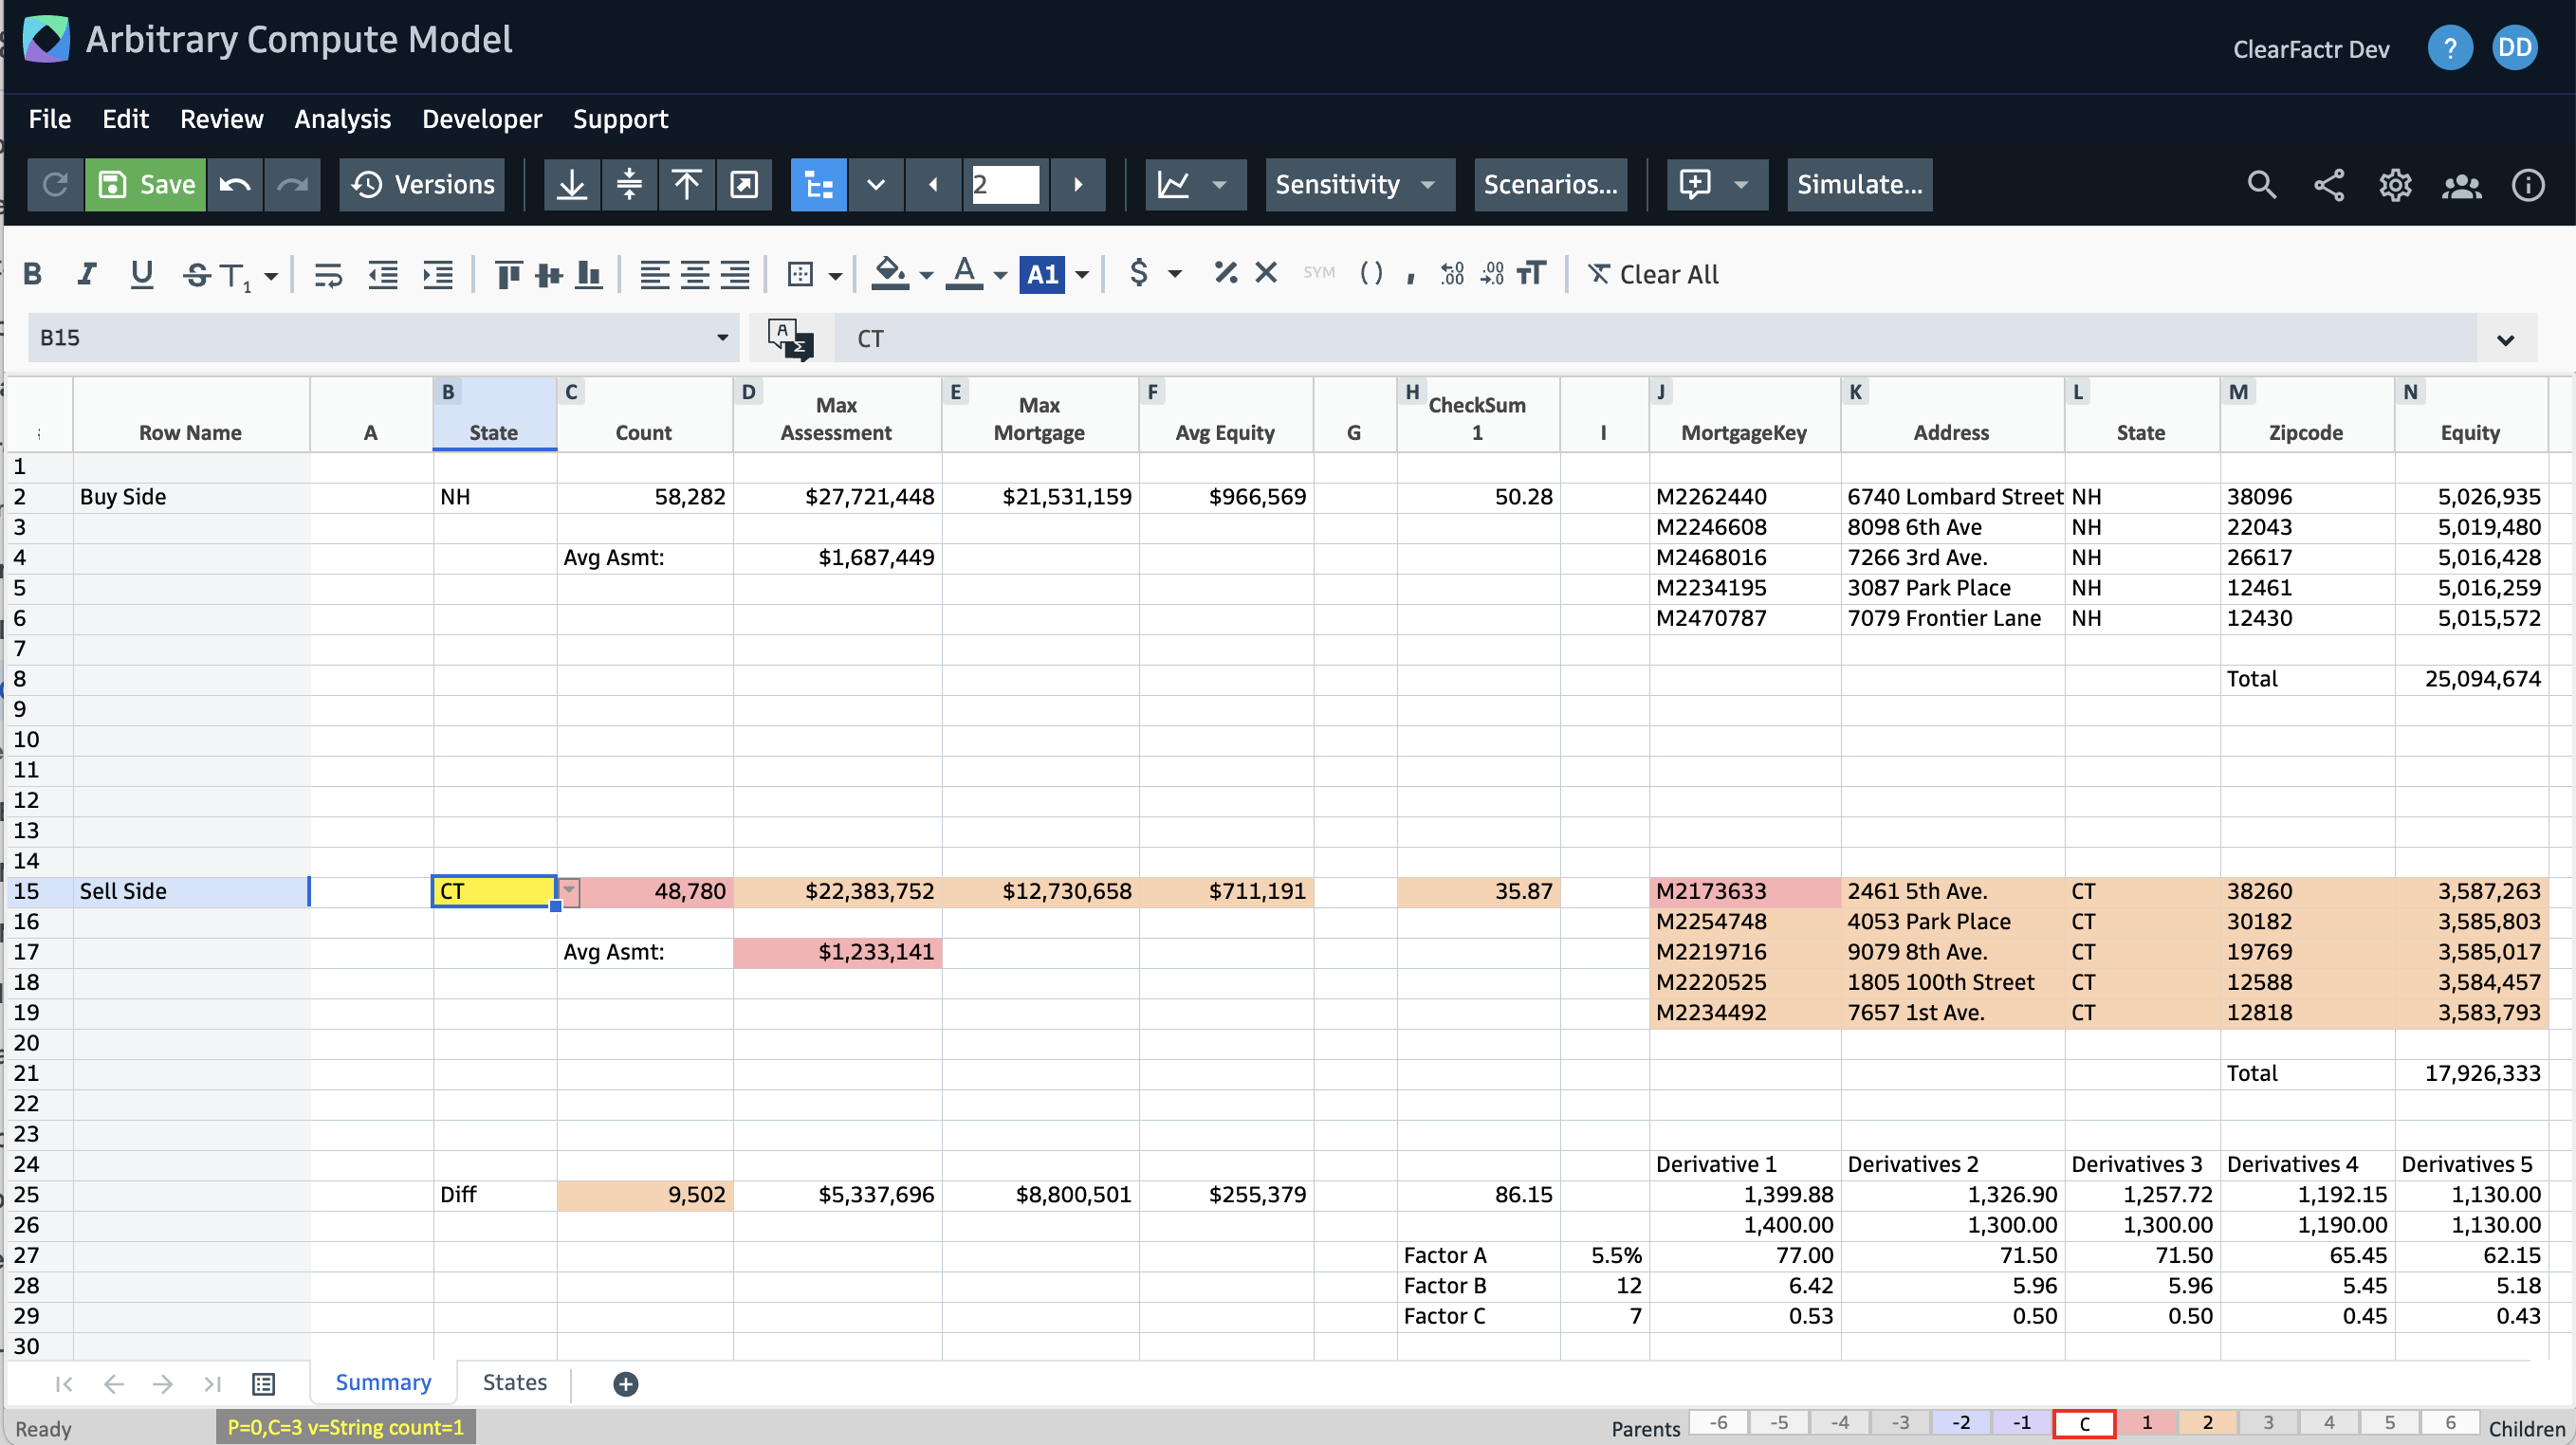
Now we're looking at NH versus CT. Note that all of the Derivative calculations in the lower right have changed, too.
Using the Sensitivity Analyzer, we can better understand how Factor A controls the Derivative calculations: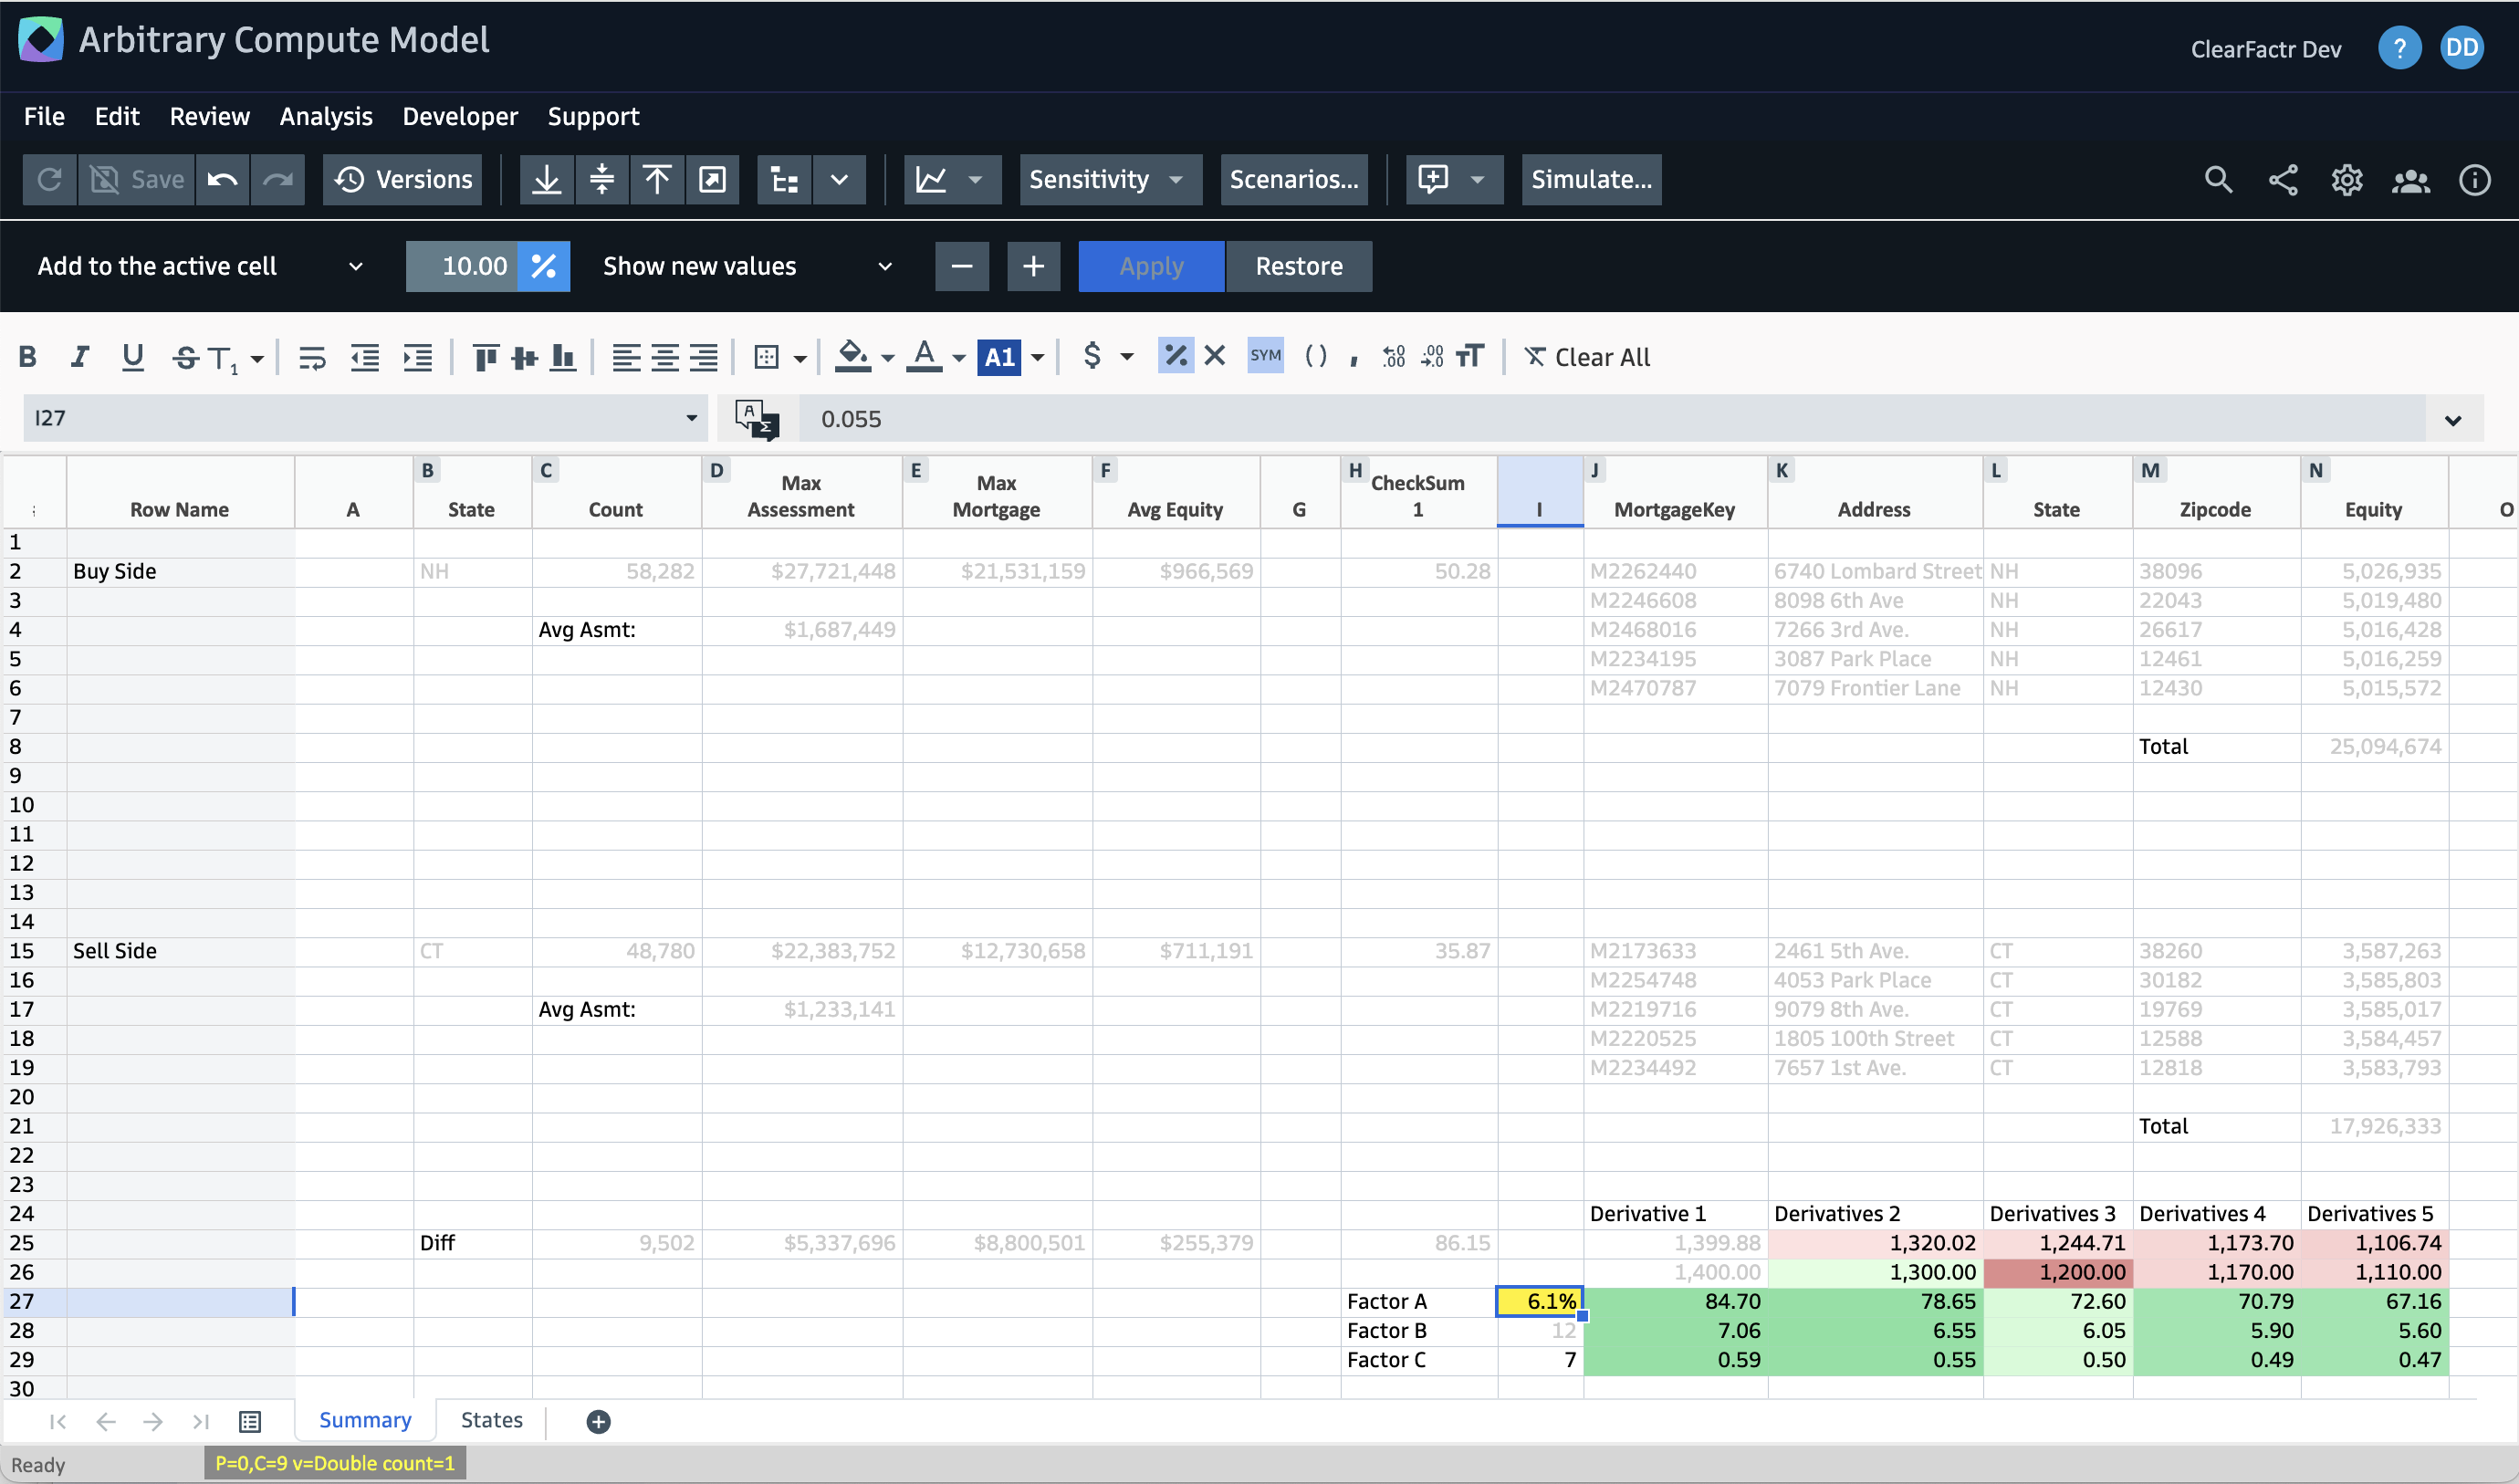
Note that most cells aren't affected... they're the ones that have been grayed out.
All of this can be called and manipulated programmatically via our REST-API, too.

Enabling all of the above is as simple as configure a Databricks-specific DataSource, via this panel, accessible from the Developers menu while viewing any model. Note this is a particularly powerful, and thus, ClearFactr Administrator enabled feature of the platform. We'll discuss all of this as we get you and your company onboarded.

When logged into your Databricks account, here's how to find the specific items you'll need for your DataSource:
Note: When testing, if you're already logged into Databricks in a browser window, you'll immediately see a JSON Access Token upon test completion. If you're not logged in, the testing process will have you authenticate yourself via Databricks' site.
Once your Databricks DataSource is configured, you'll be able to reference it in one or more CFSQL functions to bring data into your model on the fly. Click here to learn more about the Query Builder tool that facilitates this.
Please contact the ClearFactr team with any and all comments, suggestions and requests.